Checks are the key element in managing your server or website monitoring. They tell the service what addresses and services you want it to monitor.
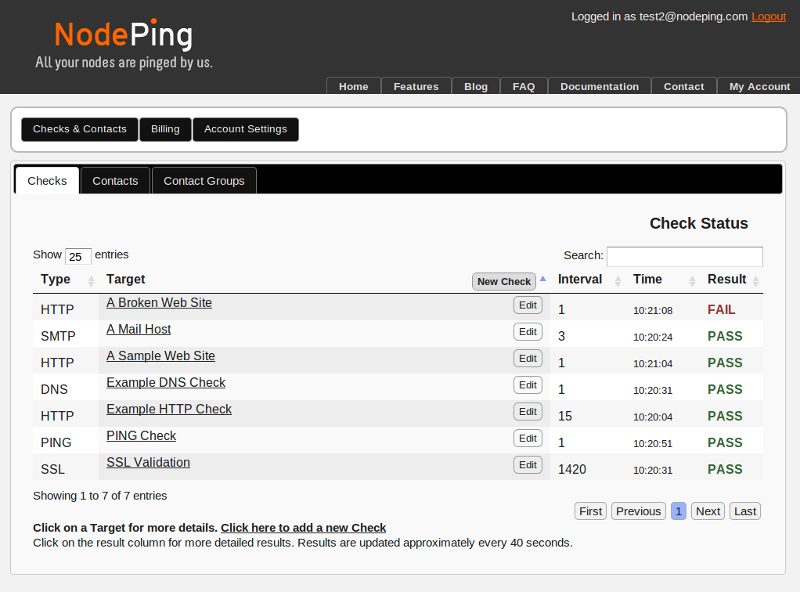
The main screen lists all of your checks and their current status. The status of each check is shown on the right side of the list. Since most checks run once a minute, the status view updates about that often as well. When you add a new check, in most cases the first result should be available and displayed in less than 90 seconds. The list shows the type of check, the label or target URL (if you didn't assign the check a label), the interval that the check is set to run at, the time of the most recent result, and the current status. Note that the time is not the time at which the status on the screen was updated, it's the actual time that the check was last run. If you have the correct access level to edit check settings, an edit button will also appear on each line of the list.
The list is fully sortable, and will remember your sort choice from the previous time you visited the page. You can also search the list by typing in the Search box at the upper right. The list will be filtered as you type, so you can see the list narrow as you enter your search term. It is often a good idea to label your checks to enhance your search capabilities. For example, if several of your checks are monitoring routers, including "router" in the label makes it easy to see all of your router checks, or you could identify physical locations in your labels to indicate where hosts are located. Careful labeling is helpful both for search and sorting.
Clicking on a check in the label column will display details about that check, including the last five results and links to the public reports (if they are enabled). There is also a link to a summary of results and chart of the response times for that check. This same chart view is also available if you click on the Results column (click on PASS or FAIL). That view also shows the total uptime percentage for the check. There is also a handy 'Clone check' link to help with the clickty clickty of creating multiple checks with similar settings.
Clicking on the Edit button for a check, or on the link to create a new check, will bring up the Edit Check dialog. The fields on the form will vary depending on what the Type field is set to. If you are creating a new check, the type is the first thing to set. The specific fields for each type of check are described on the Documentation menu.
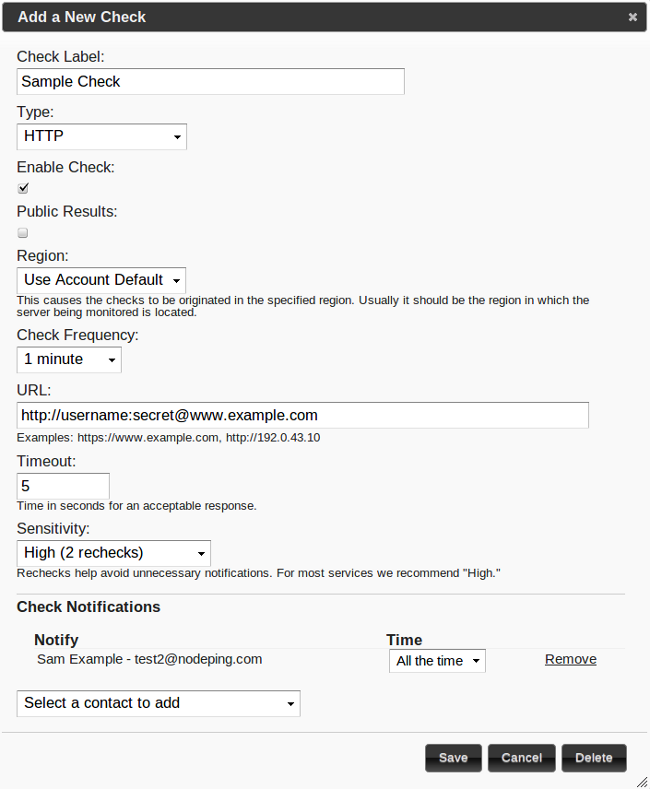
The dialog shown here is for an HTTP check, the most common check for website monitoring. The dialog for HTTP is very similar to several of our other simpler server monitoring checks. In fact, most of the fields in the HTTP dialog are present in all check types, except that the URL is called "Target" or "Address" for some check types. Several check types have additional fields specific to that protocol.
The label for a monitoring check can be just about anything. The label will be used in the status list, on reports, and in notifications, so it should be something that is meaningful particularly to the people getting notifications. If you leave it blank the system will use a reasonable default, which for most check types is the URL or Target address.
Checks can be individually enabled or disabled. Often if you are taking a server down for maintenance it is nice to disable the check temporarily to avoid a shower of notifications for an outage you already know about. You can also enable or disable checks in the detail view of the status list (accessed by clicking on the label in the list).
Choosing a region causes the checks to be monitored in that specified region. Usually it should be set to the region in which the server is located. You can choose North America, Europe, East Asia/Oceania, Latin America, or Worldwide. If no region is selected, the check will use the default region set on your account. (If your account includes custom regions, then they will be listed here too.)
Home location: if your NodePing plan includes this feature, you can choose to have the check run from one specific probe location when possible. Rechecks to verify a state change will still happen on other probes but, whenever possible, the check will be assigned to the home location. If you set this to 'Roam', the check will run from a random probe in your configured region each interval. The recommended setting is 'Default'.
The check frequency sets how often (in minutes) the check will be run. The system will run the check at whatever interval you set here. The API can be used to set a number of minutes different from what is available in the drop down in the dialog. For most checks one minute is appropriate. Sub-minute intervals are availble on some NodePing plans (30-second and 15-second intervals) and addtional costs may apply. Running monitoring checks does create a connection to the host being monitored, which often shows up in the logs, so if that is an issue either because of the logging, bandwidth usage, or some other reason you can set the check to run less frequently. Some server monitoring checks, such as the SSL certificate check, don't really need to run more often than once a day or so. In the case of the SSL certificate check, it can be set to warn you some days before the certificate expiration date.
The timeout setting sets how long the check should wait for a response before concluding that the remote service is "down." In most cases 5 seconds is a good setting for the timeout. Most web sites should respond much more quickly than that, but setting this timeout much lower will usually cause you to get more notifications than you want to get. This is particularly true on website monitoring of sites on shared hosting providers, but even for well performing sites there will be times when general Internet conditions might cause response times to go over two or three seconds. Remember that this is the time to get a response back to our monitoring servers, not the server's local response time that appears in the web server's own logs. For monitoring our own site we set this to 5 seconds, even though our web server responds to most page requests in a quarter second or less and often responds within a couple milliseconds.
The Sensitivity determines how much the service will recheck a website before concluding it is down. There are five available settings of Sensitivity, Very High, High, Medium, Low, and Very Low. High is generally recommended, but if your website is prone to flapping, you may want to set the Sensitivity lower. There is more information about Sensitivity settings, click here.
Choose an active check from the dropdown in the check edit dialog and if that selected check is already failing, notifications will not be sent for this check. When a network or server outage occurs, that can trigger a lot of notifications for services that rely on that underlying network or server. To help reduce the number of notifications you receive for dependent services, set a notification dependency.
Click 'Mute' to mute all notifications configured on the check either indefinitely or for a set duration. Click 'Unmute' to re-enable all notifications configured on the check.
Use the "Bulk Edit" button to overwrite settings on multiple checks at once. Start by checking the checkbox in the far left column of each check you want to change. You can use the 'Search' box on the top right of the table to narrow the table view to only show your desired checks. Once the checks are selected, click on the "Bulk Edit" button above the table to bring up the bulk edit dialog box. The fields that will be displayed in the dialog depend on the various kinds of checks you selected. If a mix of checks is selected, only common fields will be editable in bulk. Any changes made in the bulk edit dialog form will overwrite the existing settings on the check selected, this includes notifications. If you set notifications in bulk edit, it will replace all the existing notifications on those checks, not add to them. Click on 'Save' to apply the settings to the selected checks.
The Maintenance tab in the Account Settings area provides a link to manage your check maintenance. You can create and edit maintenance schedules as well as create an ad-hoc maintenance that will start immediately. Maintenance will disable the selected checks on a recurring schedule (or immediately for ad-hoc) and then re-enable them after a user-configured number of minutes (the 'duration' setting). Use this feature to disable a number of checks for planned maintenance so the checks don't fail and impact your uptime stats.
To leave the checks running but disable notifications on a schedule, please use our
Notification Schedules feature.
Scheduled maintenance utilizes a cron expression to generate automatic repeating schedules. If you're unfamiliar with cron expression syntax, please take a look at the wikipedia article. For the 'Cron Expression' input in the scheduled maintenance form, exclude the command portion. Only the 5 expressions should be input. Examples:
'0 0 * * *' has the scheduled maintenance start at 00:00 UTC each day.
'45 23 * * 6' has the scheduled maintenance start at 23:45 UTC every Saturday.
All cron lines are in UTC timezone.
Any checks that are disable before maintenance starts will be ignored and remain disabled during and after any configured maintenance.
Ad-hoc maintenance listings will be automatically removed when the maintenance is completed.
The General Settings tab in the Account Settings area provides a link to disable all checks on your account. Use this during widespread outages or maintenance to disable all your currently enabled checks. Note this does not affect checks on subaccounts. To re-enable your checks, use the link provided in this same area.

 Documentation
 Development
 Premiere
 Check Types